Tennis Inside Numbers explained
Presenting examples of the extensive data set shared in each match analysis
Each match analysis posted at Tennis Inside Numbers includes the following stats tables:
Match Summary
Serve & Return
1st Serves (serve directions and win percentages)
2nd Serves (serve directions and win percentages)
Winners and Errors (returns and really shots)
Strokes breakdown
Rallying - Performance maps
Points by rally length
Strategy
Points won breakdown
Below are examples of the data set that is shared in each analysis.
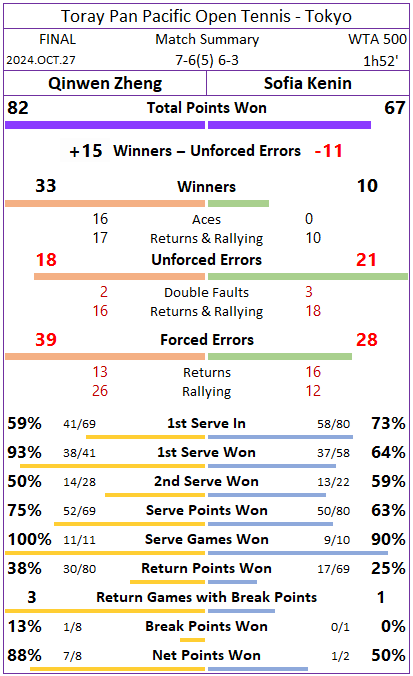
Match Summary
The summary table presents the usually-shown stats during TV coverage.
On top of that, we make sure that the often-called unknown stat line – Forced Errors (FEs) – is very visible here.
To enable quicker evaluation of players’ performances, we include the differential between winners and unforced errors right at the top.
Serve & Return
Numbers to show how each player performed on serve or while returning.
1st Serves (serve directions and win percentages)
Each serve box is divided in 4 quarters, with each roughly associated with an intended target on the returner:
forehand
body (forehand side)
body (backhand side)
backhand
The numbers shown correspond to (from top to bottom):
Number of serves placed in that quarter - in black
Aces - in grey
Number of points won by the server - in blue
Number of points won by the returner - in brown
Missed returns - in red
As returners can move in any direction before hitting their returns, numbers in purple at the bottom show exactly how many returns were hit with a forehand or a backhand.
2nd Serves (serve directions and win percentages)
For 2nd serves, there is an extra line for double faults. Everything else is similar to 1st serves.
Winners and Errors (returns and rally shots)
This table registers point-ending shots made on all strokes except serves. Included are returns, groundstrokes, volleys and overheads.
For a faster evaluation of performances, 2 “plus/minus” indexes can be checked:
winners minus unforced errors
winners minus total errors
Strokes breakdown
The Strokes breakdown table accounts for all balls struck, including shots that just kept the ball in play. Distinction between groundstrokes and volleys/overheads is also made.
A plus/minus score for each player’s wing is included. It follows the formula:
+1 for each winner
+0.5 for each forcing shot that induces an opponent’s forced error
-0.5 for each forced error made
-1 for each unforced error made
The bottom part of the table is intented to pick up players’ tendencies during rallies. They show if players are hitting more often from one particular side. Percentages presented refer to the frequency of forehands hit. Returns are excluded from this index as otherwise these numbers could just mirror serve placement, instead of reflecting how rallies played out.
Rallying - Performance Maps
Performance maps include all point-ending strokes (with the exception of serves). Point-winning shots are shown on the court on the left while point-losing shots are shown on the court on the right.
Each court is divided in 4 zones (or 6, considering the alleys).
The imaginary ball flight considered here is from bottom to top. Therefore, the bottom half of each court represents the position from where the player hit the ball (and shots are further defined as return, baseline, approach or net). The top half of the court shows where the ball landed.
For each player, there are 3 possible maps:
Match: a combination of all shots hit
Forehand: only forehands hit are included
Backhand: only backhands hit are included
Points by rally length
Rally length is determined by the ball landing in the court and not on hitting the strings. As such, double faults have rally length of 0; aces and all unreturned serves have a rally length of 1; return winners, returns that force an error, and returns that are followed by an UFE committed by the server on the next shot, all have a rally length of 2; and so on. It means odd-numbered rallies can only be won by the server and even-numbered rallies can only be won by the returner.
Information can be presented as points played by rally length (first image) or as points won by rally length (second image). The latter can be further complemented by breaking down points won according to the 3 rally length intervals most commonly used.
Strategy
Along with serve & volley points, this table shows players’ court position at the end of all points in which a rally develops, that is whenever the server is able to touch the ball a second time on a serve+1 shot.
Position is classified as “baseline” or “net approaching” and is assessed individually, therefore not dependent on the other player.
A “Baseline vs baseline points” stat line was also included in the table to demonstrate how each player fared on baseline duels, i.e. when both players finished the point simultaneously at the back of the court.
Win percentages when players attempted drop shots/drop volleys is also shown.
Points Won Breakdown
An attempt to get a broader look at the match by breaking down how each player won points. Points are listed according to their frequency (highest to lowest) and are named in relation to the last touch on the ball. Points ended during the first 4 shots of a rally (serve, return, serve+1, return+1) are properly identified while points ending on groundstrokes from the 5th shot onwards are grouped together (5th shot +).
Points won on winners are highlighted in violet while points won due to an error of the opponent are highlighted in grey.
Breakdown by side (FHs or BHs)
On this table, the highest value is 9 points won by Swiatek on “opp. serve+1 FH errors”. These were all errors committed by Samsonova on her serve+1 shots with her FH.
Breakdown by shot (UFEs or FEs; return errors on 1st or 2nd serves)
On this table, the highest value is 10 points won by Swiatek on “opp. return errors (1st srv)”. These correspond to all returns missed (FH and BHs) by Samsonova after Swiatek put a 1st serve in.


